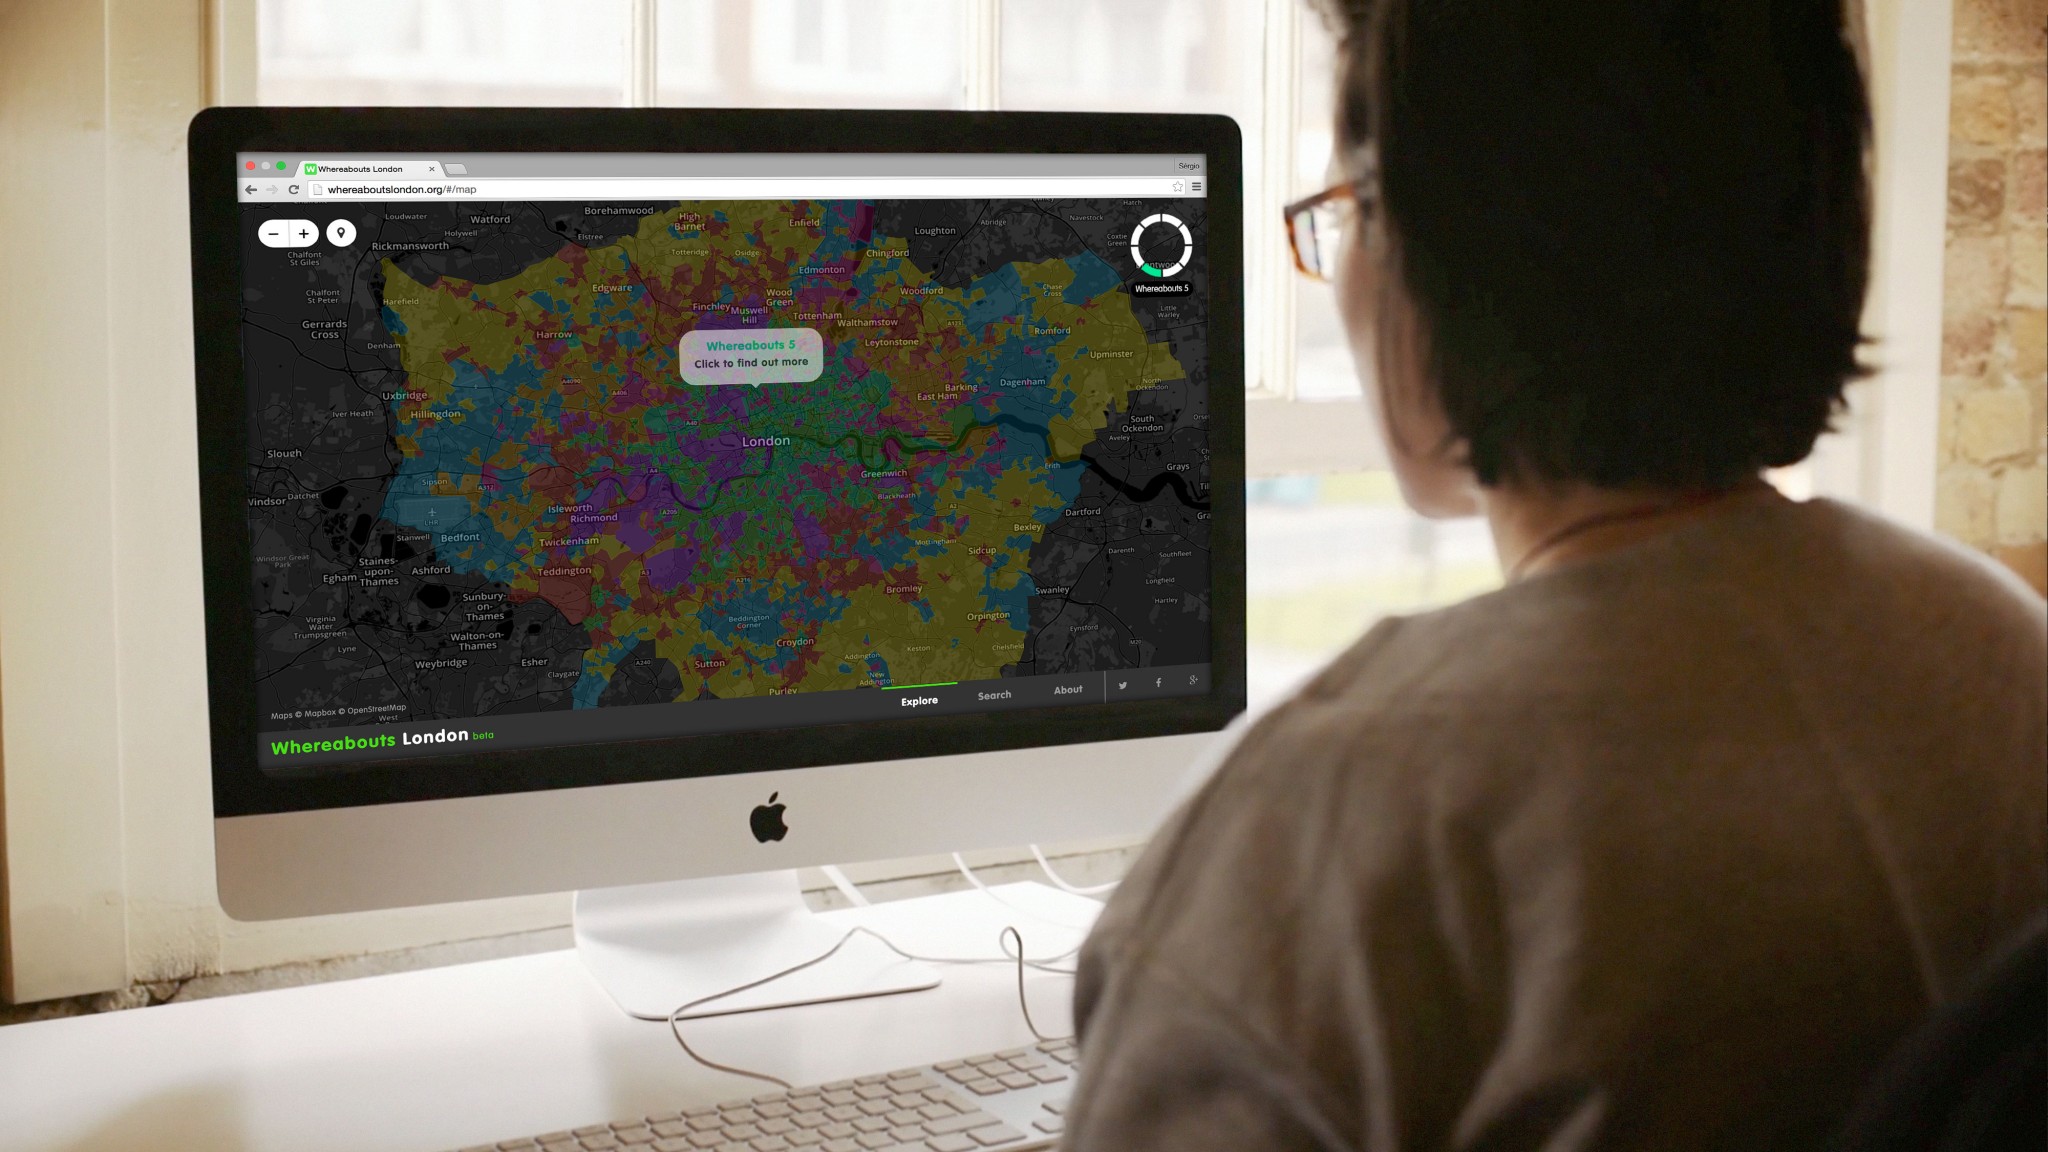
Whereabouts London
Whereabouts London is a data visualisation experiment using open city data. Designed to commemorate the launch of the second phase of the London Datastore, we analysed over 235 open datasets with machine learning techniques to redraw the map of London, clustering it into new groupings based on a variety of parameters including proximity to green space, demographics, transport links, and Flickr data.
There are 33 boroughs of London, but using techniques like those used in Whereabouts London we can expose similarities between neighbourhoods across traditional boundaries. Helping citizens explore their city through a new lens.
Tools like this could help identify where boroughs could share services, provide better services for their citizens, or even help people searching for housing in a new part of town.
My Role
Front-end development of Whereabouts London data visualisation, worked in collaboration with data scientists, designer and another web developer.
In addition to providing web development, acted as producer for this project, managing the backlog in JIRA, acting as Scrum Master and running the Agile sprints.
Technologies used for front-end development: Angular.js/HTML5/CSS3/SASS/Javascript.
Client
Company: Future Cities Catapult
Year: 2014
Role: Developer, Producer
Credits:
Design – Al Waldock
Development – Thomas Hartnell / Tim Brooke
Data Science – Rudi Ball / Adam Rae
Whereabouts London at the Royal Society
Alan and I showcased Whereabouts London at the Royal Society as part of an interactive exhibition about Machine Learning, supporting the event Learning machines – How computers got smart.
The photo opposite shows us demonstrating Whereabouts London to BBC technology correspondent Rory Cellan-Jones.
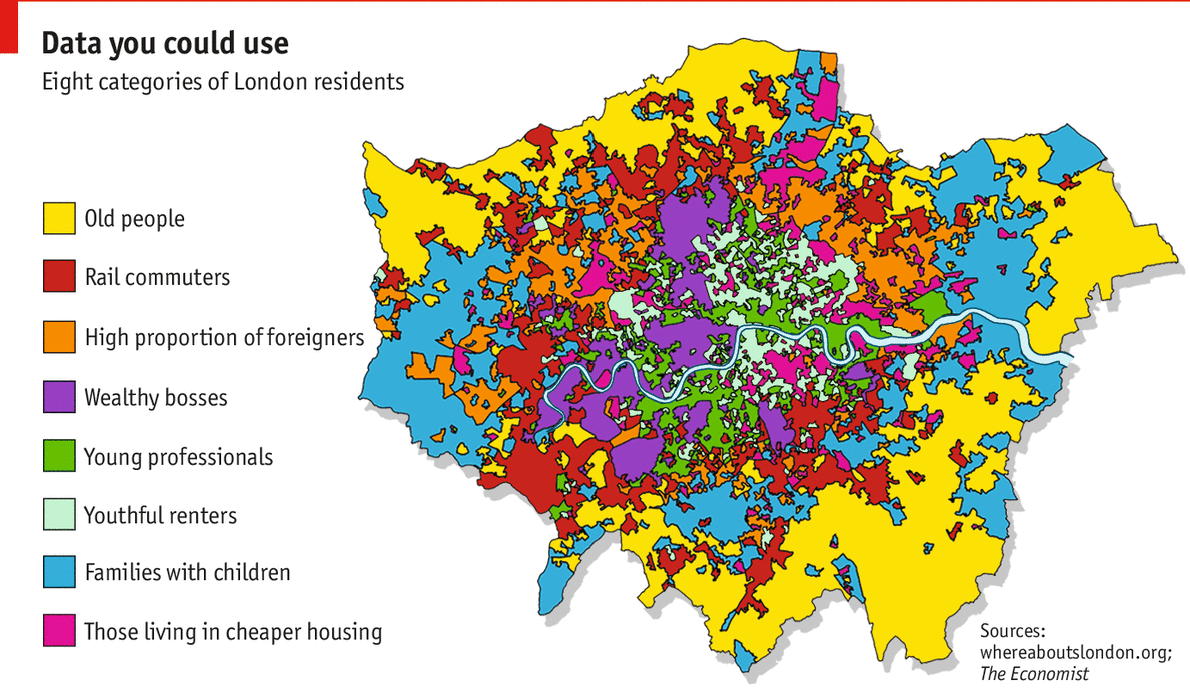
In the Economist
We were delighted when Whereabouts London was featured in the Economist. They also decided to name our Whereabouts groups, please see this below…